

Agile. Self-service. No Learning Curve.
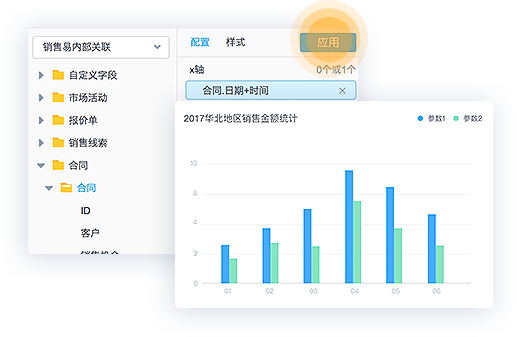
Anyone can build custom reports
Whether it is at the executive, decision-making or daily operational level, you can easily define business entities, drag and drop, and build custom reports with zero learning cost. So everyone becomes a data analyst.
Native. Unified. Complete.
Meet Any Business Need
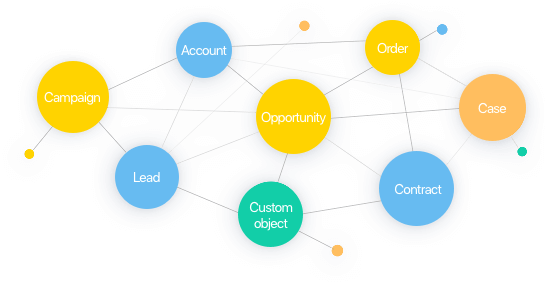
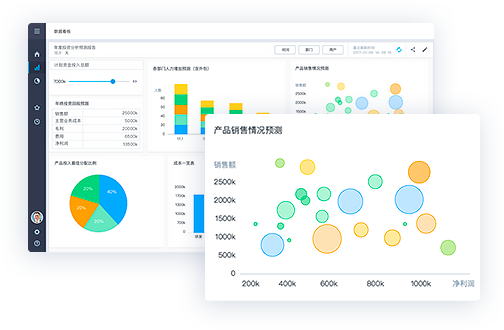
Seamlessly integrated with Neocrm, our BI engine provides deep insights into marketing, sales and service activities. BI dashboard can be easily embedded into key business modules, so you can fully grasp customer information in a 360-degree view, and quickly close key sales deals.
Data visualization provides a graphical representation of business insights. You can build reports across multiple business objects, and analyze correlations among them, ultimately driving business growth.
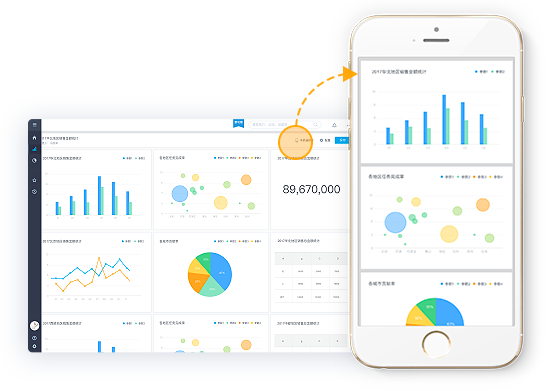
Mobile First. Analyze Data Anytime, Anywhere
Seamlessly synchronize data between mobile devices and PC, allowing views of data reports anytime, anywhere.
Easily configure reports to be shown on mobile devices, with rich formats and analytical dimensions, grasping the business status from multiple perspectives.
One-click sharing enables colleagues to discuss issues and solutions in a timely manner.
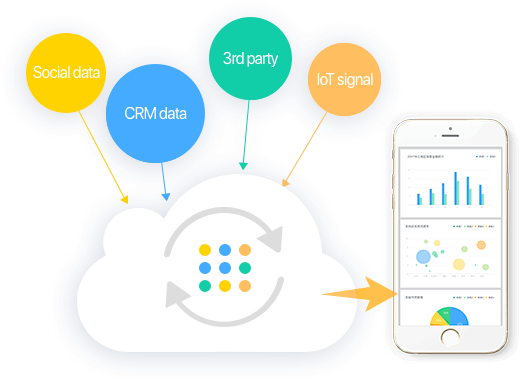
Gain Timely Insights. Take Immediate Actions
Collect and integrate all data in real time: CRM data, social data, 3rd-party data, etc., obtain insights across multiple sources and create timely action plans.
Intelligent Forecasting
Enable Predictive Analytics
Discover underlying patterns and get accurate forecasts on sales targets or other KPIs with Intelligent Forecasting.
Self-service Intelligent Business Analytics Platform

Cloud Based
Low-cost, distributed processing technology ensures reliable, efficient and scalable processing of massive data

Data Warehouse
Data warehouse constructs, stores and analyzes high volume data such as CRM, social, and third-party data

Data Security
Data access control with role based permissions, different roles will access different contents

Multi-device Presentation
Seamlessly synchronized Mobile and Web presentations, help you view real-time data on the fly

Flexible Data Source
Identify correlations across multiple data sets and business objects, unveiling the underlying links

Diagrams and Graphs
Visualize data with rich formats, meeting your specific needs

Dashboard
Diagrams and graphs can be combined and displayed on unified dashboards, vividly showing underlying schema

Report Sharing
Share your data with colleagues to facilitate collaboration and discussion
 FREE TRIAL